
RESEARCH ARTICLE
Upregulation of Adhesion Molecules Sustains Matrix-Free Growth of Human Embryonic Stem Cells
Narmin Bigdeli1, *, #, Giuseppe Maria de Peppo2, 3, #, Camilla Karlsson2, 3, Maria Lennerås2, 3, 4, Raimund Strehl5, Johan Hyllner6, Anders Lindahl1, 2
Article Information

Identifiers and Pagination:
Year: 2018Volume: 5
First Page: 14
Last Page: 30
Publisher Id: TOSCJ-5-14
DOI: 10.2174/1876893801805010014
Article History:
Received Date: 4/9/2018Revision Received Date: 11/10/2018
Acceptance Date: 16/10/2018
Electronic publication date: 23/11/2018
Collection year: 2018
open-access license: This is an open access article distributed under the terms of the Creative Commons Attribution 4.0 International Public License (CC-BY 4.0), a copy of which is available at: https://creativecommons.org/licenses/by/4.0/legalcode. This license permits unrestricted use, distribution, and reproduction in any medium, provided the original author and source are credited.
Abstract
Background:
Despite recent advances in culture techniques for undifferentiated human Embryonic Stem Cells (hESCs), further improvements are required to facilitate research and translation of these cells in clinical settings. We have previously derived hESC lines that can be cultured in their undifferentiated state on regular plastic culture dishes, without the need for feeder cells or other coating supports, denoted Matrix-Free Growth hESCs (MFG-hESCs).
Objective:
In this study, we further characterize and compare MFG-hESCs to hESCs in order to understand the molecular differences responsible for the unique ability of MFG-hESCs.
Results:
Microarray analysis demonstrated that MFG-hESCs highly resemble feeder-cultured hESCs in global gene expression profile. Two identified groups of genes with differential expression were those encoding for ribosomal proteins and attachment proteins, such as the RGD (Arg-Gly-Asp)-associated proteins. Real-time PCR and flow cytometry corroborated the microarray results. Culture of MFG-hESCs in the presence of RGD peptides resulted in decreased attachment ability compared to cells cultured in the presence of RGES (Arg-Gly-Asp-Ser) peptides.
Conclusion:
This study demonstrates that MFG-hESC lines overexpress cell attachment proteins but retain the typical characteristics of undifferentiated feeder-cultured hESCs. The ability to culture high-quality pluripotent stem cells in feeder- and matrix-free conditions creates a new opportunities for their large-scale manufacturing for experimental research and translational applications.
1. INTRODUCTION
Human embryonic Stem Cells (hESCs) self-renew and can differentiate into all cells constituting the human body [1, 2]. Owing to these properties, hESCs can be used to study development and disease and further to regenerate and restore functionality of damaged or malfunctioning tissues and organs. After successful derivation and culture of hESCs lines in the late 90’s [1], the interest for pluripotent stem cells has grown exponentially, culminating in the derivation of human induced pluripotent stem cells (iPSCs) via reprogramming of somatic cells in 2006 [3, 4]. The ability to maintain the stemness properties of pluripotent stem cells during long-term culture, and yet induce differentiation into multiple lineages, is a prerequisite for disease modelling, drug screening and therapeutic cell replacements [5, 6]. However, substantial advances in cell manufacturing technologies are required before hESCs can be employed for the treatment of human medical conditions. Development of simple culture procedures, cost-effectiveness, phenotypic stability under defined xeno-free culture conditions, and compliance with Good Manufacturing Practice (GMP) are some of the issues that must be addressed. Traditionally, hESCs were cultured on mouse embryonic fibroblast (mEF) feeder layers in serum containing media [1]. However, due to concerns on mouse-human transfer of viruses [7] and immunogenic epitopes, such as N-glycolylneuraminic acid (Neu5Gc) non-human sialic acid [8], a variety of human tissues have been tested in order to find suitable feeder layer replacements [9]. For instance, human foreskin fibroblasts have been used to isolate xeno-free and clinical-grade hESC lines [10]. However, batch-to-batch variability of isolated feeder cells still remains a concern for the consistent large-scale manufacturing of hESCs [11]. As an alternative to feeder cells, the ability of extracellular matrix (ECM) components to support hESC attachment and proliferation has been evaluated, such as MatrigelTM [12, 13], Geltrex® [14], fibronectin, laminin, entactin, and vitronectin [7, 15, 16]. Unfortunately, these substrates are expensive, require cold storage and preparation prior to cell culture, lose their biological properties when dehydrated, and do not meet the requirements for clinical translation.
We have previously reported the derivation of hESCs capable to attach and grow directly on regular plastic culture dishes without the need for feeder cells or other supportive substrate materials. These cells, denoted matrix-free growth adapted hESCs (MFG-hESCs), highly resemble feeder-cultured hESCs in morphology, expression of pluripotency markers, ability to differentiate into tissues of all three germ layers and form teratoma in vivo while retaining a normal karyotype [17, 18].
However, no knowledge exists on the molecular changes that are responsible for the unique ability of MFG-hESCs to attach and grow on regular plastic culture dishes in their undifferentiated state. Therefore, in this study, we have further characterized and compared MFG-hESCs with feeder-cultured hESCs with the aim to unveil the mechanisms underlying the MFG-hESCs properties. MFG-hESCs and feeder-cultured hESCs were expanded in their respective culture conditions, and subjected to microarray analysis to compare their gene expression profile and identify differentially expressed genes that could account for the phenotypic characteristics of MFG-hESCs. Real-time PCR, flow cytometry, and functional assays were used to verify the microarray findings.
2. MATERIALS AND METHODS
2.1. Establishment and Culture of hESCs
Three undifferentiated hESCs lines were used as a control and compared to two feeder-free MFG-hESC lines. The undifferentiated feeder-cultured hESC lines (SA167 at passage 30, SA461 at passage 50, and SA002 at passage 34) used in this study were derived and characterized at Cellartis AB (Gothenburg, Sweden) [19-21]. Detailed protocols are available at www.cellartis.com. The undifferentiated MFG-hESC lines (SA167MFG at passage 14 and AS034.1MFG at passage 53) used in this study were derived and characterized in our laboratory as previously described [17].
2.2. Feeder-Free Culture of hESCs
We recently reported the derivation of two feeder- and matrix-free hESC lines [17]. In brief, cultured hESC lines were transferred from mEF layers to MatrigelTM (Matrix Thin Layer; Becton Dickinson, Bedford, MA, USA) [20], and subsequently adapted to adhere and grow on regular plastic culture dishes by treating the cells with neonatal chondrocyte (NC)-conditioned hESC [17]. Thereafter, the MFG-hESC lines were cultured directly on plastic surfaces without any supportive coating in the presence of fibroblast-conditioned hES medium [17], composed of KnockOutTM Dulbecco Modified Eagle Medium (KO-DMEM; Gibco-BRL/Invitrogen, Gaithersburg, MD, USA) containing 20% KnockOutTM serum replacement (KO-SR; Gibco-BRL/Invitrogen), 2 mM L-Glutamine (Gibco-BRL/Invitrogen), 0.1 mM β-mercaptoethanol (Gibco-BRL/Invitrogen) and 1% nonessential amino acids (NEAA; Gibco-BRL/Invitrogen) on Primaria® dishes (Becton Dickinson, Franklin Lakes, USA). Cells were cultured in a humidified atmosphere at 37°C and 5% CO2 (Heraeus BBD6220). The medium was changed every two days.
2.3. RNA Isolation
For RNA isolation, the hESC lines SA167, SA461 and SA002 were mechanically dissociated using a “Stem Cell Tool” (Swemed Lab International AB, Billdal, Sweden), while MFG-hESC lines SA167MFG and AS034.1MFG were dissociated using collagenase (Sigma-Aldrich). Total RNA was extracted using the RNeasy® Minikit (QIAGEN GmbH, Hilden, Germany) according to the manufacturer’s instructions. DNAse treatment was performed in order to eliminate any contamination from genomic DNA according to Qiagen RNase Free DNase Set (QIAGEN GmbH) protocol.
2.4. Microarray Analysis
Global gene expression analysis was conducted using the Affymetrix oligonucleotide microarray HG-U133plus2.0 (Affymetrix, Santa Clara, CA) according to the manufacturer’s recommendations. Briefly, 2 µg of the total RNA were used to synthesize biotin-labeled cRNA. Ten µg of fragmented cRNA were then hybridized to GeneChips for 16 h at 45°C. Washing, staining and scanning of the microarrays were performed using the Affymetrix GeneChip equipment. Raw expression data were normalized and subsequently analyzed with the GeneChip Operating Software 1.4 (GCOS, Affymetrix). Comparative and statistical analyses were performed with the BIORETIS web tool (http://www.bioretis-analysis.de). Only genes were selected for further analysis if more than 80% of the single comparisons per group comparison were detected as significantly changed by the GCOS, and the genes displayed a mean fold change (FC) ≥3. Functional classification was conducted with annotations from the Gene Ontology Annotation Database (GOA). The expression of 40 genes specifically expressed in hESCs, 30 genes under-expressed in hESCs compared to differentiated cell types, and 48 genes over-expressed in hESCs compared to differentiated cell types was investigated. Expression differences were given as FC. The significance level was determined by applying the Welch’s t-test on log2-transformed signal values. To visualize the similarity in global gene expression across the investigated samples, scatter plots were generated between average signals of pairs of samples using the standard function in R.
2.5. Analysis of Protein Interaction Network
To investigate the possible interactions among proteins from differentially regulated genes (defined by having a mean FC≥3) between MFG-hESC and hESC lines, the search tool STRING was used to mine for recurring instances of neighbouring genes. STRING aims to collect, predict, and unify various types of protein-protein associations, including direct (physical) and indirect (functional) associations. A gene of interest was classified as a hub if it had ≥5 interactions with other genes [22]. As a default, STRING uses four different sources (genomic context, high-throughput experiments, coexpression, and previous knowledge) to derive protein interaction maps. However, in order to increase the validity of the study, only experimentally determined protein interactions were included in the analysis.
2.6. Real-time PCR
Real-time PCR was used to verify the results obtained from the microarray analysis for the expression of NANOG, OCT4, TDGF1, SOX2, GAL, IGFBP7, COL5A2 and COL11A1. Primers for these genes were designed using the Primer3 web-based software. Design parameters were adjusted to minimize the formation of artifact products and to be able to use an annealing temperature of 60°C. Primers were designed to yield short amplicons (preferably shorter than 200 bp) and to function well with SYBR Green I fluorescent dye for detection of the PCR products in real-time. Assays and detailed protocols are available from TATAA Biocenter AB (Göteborg, Sweden; http://www.tataa.com). Real-time PCR was performed in duplicates using the Mastercycler ep realplex (Eppendorf, Hamburg, Germany). Cycling conditions were 95°C for 10 min followed by 45 cycles of 95°C for 20 s, 60°C for 20 s, and 72°C for 20 s. The fluorescence was read at the end of the 72°C step. Melting curves were recorded after the run by stepwise temperature increase (1°C/5s) from 65-95°C. Quantities of target genes were presented as normalized to the number of cells using the expression of the 18S ribosomal subunit. Normalized relative quantities were calculated using the delta Cq method and 90% PCR efficiency (k*1.9∆cq). Statistical analysis was performed using the Mann-Whitney test. P-values <0.05 (*) were considered statistically significant differences.
2.7. Flow Cytometry Analysis
Flow cytometry was used to verify the microarray results obtained for the expression of ITGB3, ITGB6, CD58, CD47, and CD44. Briefly, cells were resuspended in 100 µl of PBS (0,1% bovine serum albumin; Sigma-Aldrich), stained with primary antibodies (all from R&D Systems, Abingdon, UK), and incubated in the dark at room temperature for 15 min. For all analysis, cells were detached using trypsin, washed twice with PBS, and then treated with the proper fluorochrome-labeled antibodies. After incubation for 15 min at room temperature in the dark, samples were analyzed by flow cytometry within 1 h. All samples were analyzed using the FACS Aria flow cytometer equipped with the FACS Diva software. A 488 nm argon ion laser was used to excite samples, with emission being measured using appropriate bandpass filters. A threshold was set on the scattered light to exclude events associated with debris and cell aggregates. As a negative control, isotype-specific antibodies conjugated to the fluorochromes were used in order to exclude events associated with non-specific fluorescence. Cells displaying fluorescence higher than 99% of the cells stained with isotype antibodies were considered positively stained.
2.8. RGD peptide Cultures
To functionally demonstrate the role of adhesion molecules on the MFG-hESCs ability to grow on regular plastic culture dishes, cells were detached to single cell suspensions using trypsin, and cultured with conditioned hESC medium (described above) containing 500 µg/ml of RGD peptide (Sigma-Aldrich, Stockholm, Sweden). Conditioned hESC medium (described above) containing 500 µg/ml of RGES peptide (Sigma-Aldrich) was used as a control. The cells were incubated in a humidified atmosphere at 37°C and 5% CO2 (Heraeus BBD6220). The number of attached cells was counted manually in both culture conditions using a contrast microscope (Nikon, Japan) 24 h after seeding. Statistical analysis was performed using the Mann-Whitney test. P-values <0.05 (*) were considered statistically significant differences.
3. RESULTS
Following expansion on regular plastic culture dishes, MFG-hESCs look morphologically equivalent to hESCs cultured on mEFs (Fig. 1).
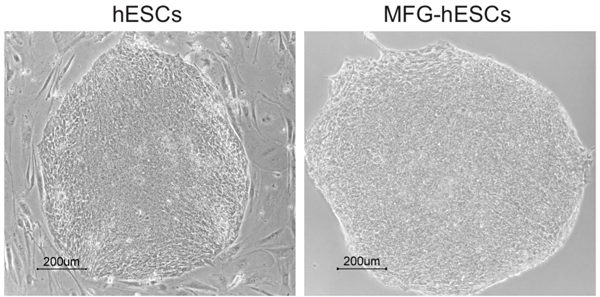 |
Fig. (1). Morphology of hESCs (SA167) cultured on mouse feeder cells and SA167MFG cultured on tissue culture plastic. Abbreviations: hESCs, human embryonic stem cells; MFG-hESCs, matrix-free growth adapted human embryonic stem cells. |
3.1. Global gene expression comparison shows a significantly higher expression of several RDG-associated genes in MFG-hESCs
Global analysis of microarray data demonstrates that MFG-hESCs and hESCs display a similar gene expression profile, with 74% of the genes exhibiting a FC≤3 (Fig. 2a) and a Pearson correlation coefficient of 0.94. Protein-protein interaction analysis of differentially expressed genes (FC ≥3) identifies 11 hub genes with increased expression in MFG-hESCs compared to hESCs, including the ribosomal genes RPLP2, RPL38, RPL37A, RPL27A, RPS11, RPS15, IF2, nPL14 and EIF3S5, and two genes belonging to the family of integrins, such as ITGB5 and CAV1 (Fig. 2b). For genes with a decreased expression in MFG-hESCs, five clusters are identified, of which one contains the NUP133 and NUP100 genes and the other the JUN, MXI2, NS1, FUS, DHX9, HNRPU, HNRPH1, SF3B1, PRPF6, and SFRS11 hub genes (Fig. 2c).
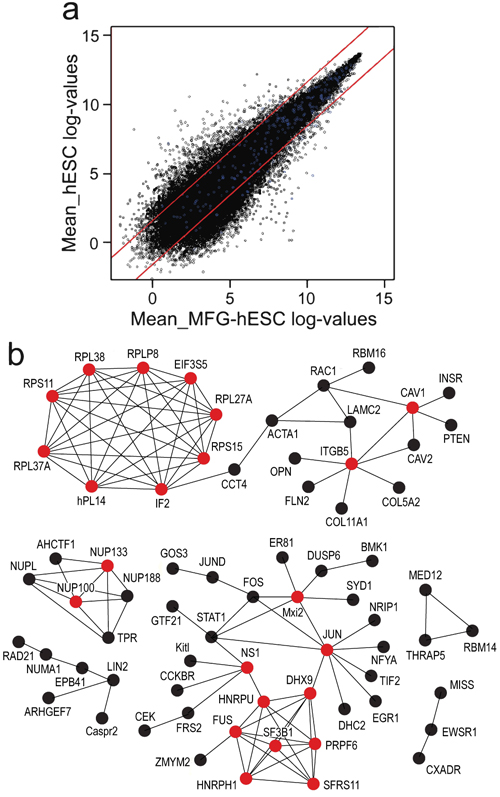 |
Fig. (2). Scatter plot (a) where genes within the red lines indicate a FC of less than ±3 and blue dots indicate genes characteristic of feeder-cultured hESCs (also shown in Table 1 and MFG-hESCs. Hub protein network of genes overexpressed (b) and underexpressed (c) in MFG-hESCs compared to feeder-cultured hESCs with a FC ≥3. Proteins are identified as hubs if they have at least five experimentally determined protein interactions among the products of the up-regulated genes. Red circle = hub protein. Abbreviations: FC, fold change; hESCs, human embryonic stem cells; MFG-hESCs, matrix-free growth adapted human embryonic stem cells. |
Genes specifically expressed in hESCs, including NANOG, OCT4, and TDGF1 display a similar level of expression in both MFG-hESCs and hESCs (Table 1a). RBM14 is the only gene differentially regulated, showing significantly lower expression in MFG-hESCs compared to hESCs. When studying the genes that are known for their low expression in hESCs compared to differentiated cells, only 5 out of 30 genes appear to be differentially regulated, with a higher expression in MFG-hESCs. These genes include BMP4, COL11A1, COL5A2, COL6A3, and IGFBP7 (Table 1b). When analyzing genes overexpressed in hESCs compared to differentiated cells, the results show that 4 out of 47 genes are differentially expressed in MFG-hESCs and hESCs, such as PHF17, PSIP1, SNRPN, and USP9X, which all display an FC<4 (Table 1c). The most differentially expressed genes comparing MFG-hESCs and hESCs are also investigated and summarized in Table 2.
1a.
| Gene Symbol | Gene | P-value | FC |
|---|---|---|---|
| ABHD9 | Abhydrolase domain containing 9 | 7.7E-01 | -1.09 |
| C14orf115 | Chromosome 14 open reading frame 115 | 1.0E-03 | 1.30 |
| CDC25A | Cell division cycle 25 homolog A | 3.6E-02 | -1.92 |
| CHEK2 | CHK2 checkpoint homolog | 9.5E-01 | -1.01 |
| CLDN6 | Claudin 6 | 1.1E-02 | -1.53 |
| CXorf15 | Chromosome X open reading frame 15 | 7.7E-02 | 0.52 |
| CYP26A1 | Cytochrome P450, family 26, subfamily A1 | 1.8E-01 | -3.59 |
| DNMT3A | DNA (cytosine-5-)-methyltransferase 3 alpha | 7.0E-02 | 0.41 |
| DTYMK | Deoxythymidylate kinase | 3.0E-01 | -0.90 |
| EPHA1 | EPH receptor A1 | 1.1E-01 | -0.12 |
| ETV4 | Ets variant gene | 2.6E-01 | -1.56 |
| GDF3 | Growth differentiation factor 3 | 2.9E-01 | -1.32 |
| GPR19 | G protein-coupled receptor 19 | 4.6E-01 | -1.30 |
| HELLS | Helicase | 3.1E-01 | 0.18 |
| HESX1 | HESX homeobox 1 | 2.0E-04 | -2.42 |
| LIN28 | Lin-28 homolog | 3.3E-01 | -1.06 |
| MCM10 | Minichromosome maintenance complex 10 | 3.2E-02 | -0.57 |
| MYBL2 | V-myb myeloblastosis viral oncogene-like 2 | 1.8E-01 | -1.50 |
| NANOG | Nanog homeobox | 5.9E-01 | -1.14 |
| ORCL1 | Origin recognition complex, subunit 1-like | 1.0E-21 | -2.30 |
| ORCL2 | Origin recognition complex, subunit 2-like | 1.0E-21 | -1.46 |
| OCT-4 | Octamer-binding transcription factor 4 | 3.1E-01 | -1.13 |
| PRDM14 | PR domain containing 14 | 3.1E-01 | 1.27 |
| RBM14 | RNA binding motif protein 14 | 1.0E-21 | -4.54 |
| SLC5A6 | Solute carrier family 5 member 6 | 1.0E-21 | -2.28 |
| TDGF1 | Teratocarcinoma-derived growth factor 1 | 2.9E-01 | 1.29 |
| TMEM137 | Transmembrane protein 137 | 1.0E-21 | 2.76 |
| ZIC3 | Zic family member 3 | 4.4E-03 | -1.55 |
| Gene Symbol | Gene | P-value | FC |
|---|---|---|---|
| ACTA2 | Actin, alpha 2, smooth muscle, aorta | 3.3E-01 | 2.29 |
| BMP1 | Bone morphogenetic protein 1 | 3.7E-01 | -0.16 |
| BMP4 | Bone morphogenetic protein 4 | 4.3E-03 | 10.24 |
| CD47 | CD47 molecule | 2.0E-02 | 3.23 |
| CDKN1A | Cyclin-dependent | 4.3E-01 | 1.70 |
| COL11A1 | Collagen, type XI, alpha 1 | 5.0E-04 | 4.86 |
| COL1A1 | Collagen, type I, alpha 1 | 1.9E-01 | 3.77 |
| COL1A2 | Collagen, type I, alpha 2 | 3.1E-02 | 2.43 |
| COL2A1 | Collagen, type II, alpha 1 | 1.4E-01 | -4.51 |
| COL3A1 | Collagen, type III, alpha 1 | 4.6E-01 | -0.51 |
| COL5A1 | Collagen, type V, alpha 1 | 5.8E-02 | 1.94 |
| COL5A2 | Collagen, type V, alpha 2 | 1.0E-04 | 3.99 |
| COL6A3 | Collagen, type VI, alpha 2 | 1.0E-21 | 3.25 |
| CST3 | Cystanic C | 2.1E-01 | -1.64 |
| CXCL14 | Chemokine (C-X-C motif) ligand 14 | 7.3E-02 | 2.99 |
| DCN | Decorin | 5.1E-02 | 2.35 |
| HAND1 | Heart and neural crest derivatives 1 | 2.0E-01 | 1.82 |
| KRT8 | Keratin 8 | 9.3E-02 | 1.53 |
| IGF2 | Insulin-like growth factor 2 | 1.8E-01 | 2.08 |
| IGFBP3 | Insulin-like growth factor binding protein 3 | 8.0E-04 | 2.85 |
| IGFBP7 | Insulin-like growth factor binding protein 7 | 3.2E-03 | 27.68 |
| IL6ST | Interleukin 6 signal transducer | 3.3E-01 | 1.19 |
| KRT18 | Keratin 18 | 1.9E-02 | 1.69 |
| KRT19 | Keratin 19 | 2.9E-01 | 1.39 |
| KRT7 | Keratin 7 | 1.9E-01 | 2.45 |
| LUM | Lumican | 8.9E-01 | 1.25 |
| NDRG1 | N-myc downstream regulated gene 1 | 1.9E-03 | 1.74 |
| P4HA2 | Procollagen-proline | 1.0E-04 | 2.19 |
| RHOBTB3 | Rho-related BTB domain containing 3 | 2.5E-01 | -0.42 |
| SPARC | Osteonectin | 7.1E-02 | 1.46 |
| Gene Symbol | Gene | P-value | FC |
|---|---|---|---|
| AASS | Aminoadipate-semialdehyde synthase | 4.0E-04 | 3.03 |
| ALPL | Alkaline phosphatase, live/bone/kidney | 8.6E-02 | -1.33 |
| BMPR1A | Bone morphogenetic protein receptor, type IA | 1.2E-01 | -1.11 |
| BUB1 | BUB1 budding uninhibited by benzimidazoles 1 | 1.0E-04 | 1.55 |
| CEBPZ | CCAAT/enhancer binding protein zeta | 8.0E-01 | -1.05 |
| CRMP1 | Collapsin response mediator protein 1 | 3.1E-01 | -1.22 |
| CYP26A1 | Cytochrome P450, family 26, subfamily A1 | 1.8E-01 | -3.59 |
| DNMT3B | DNA (cytosine-5)-methyltransferase 3 beta | 1.8E-01 | 1.41 |
| DPPA4 | Developmental pluripotency associated | 4.4E-02 | 1.49 |
| GABRB3 | GABA A receptor, beta 3 | 2.6E-01 | 1.20 |
| GAL | Galanin prepropeptide | 3.2E-03 | 1.62 |
| GDF3 | Growth differentiation factor 3 | 2.9E-01 | -1.32 |
| GPC4 | Glypican 4 | 1.0E-04 | 2.06 |
| HELLS | Helicase | 3.1E-01 | 0.18 |
| HRASLS3 | HRAS-like suppressor 3 | 2.3E-01 | 1.55 |
| HSPA4 | Heat shock 70kDa protein 4 | 4.0E-04 | 1.21 |
| INDO | Indoleamine-pyrrole 2,3 dioxygenase | 3.2E-01 | 1.91 |
| ITGB1BP3 | Integrin beta 1 binding protein 3 | 2.1E-01 | 1.74 |
| LECT1 | Leukocyte cell derived chemotaxin 1 | 2.6E-01 | 1.74 |
| LEFTY1 | Left-right determination factor | 1.3E-01 | 3.05 |
| LIN28 | Lin28 homolog | 3.3E-01 | 1.06 |
| LOC730017 | 3.9E-01 | 1.82 | |
| M6PR | Mannose-6-phosphate receptor | 1.0E-21 | -1.82 |
| MCM5 | Minichromosome maintenance complex 5 | 1.0E-04 | -1.68 |
| MGST1 | Microsomal glutathione S-transferase 1 | 1.5E-01 | 1.37 |
| MSH2 | MutS Homolog 2 | 1.0E-21 | -1.52 |
| MTHFD1 | Methylenetetrahydrofolate dehydrogenase | 2.7E-01 | -1.10 |
| NANOG | Nanog homeobox | 5.9E-01 | -1.14 |
| NASP | Nuclear autoantigenic sperm protein | 6.0E-01 | 1.33 |
| ORC1L | Origin recognition complex, subunit 1-like | 1.0E-21 | -2.30 |
| PHF17 | PHD finger protein | 1.0E-21 | 3.70 |
| PIM2 | Pim-2 oncogene | 3.0E-04 | 3.85 |
| OCT-4 | Octamer-binding transcription factor 4 | 3.1E-01 | -1.13 |
| PPAT | Phosphoribosyl pyrophosphate amidotransferase | 1.0E-21 | 1.62 |
| PSIP1 | PC4 and SFRS1 interacting protein 1 | 1.0E-21 | 3.40 |
| SEMA6A | Sema domanin 6A | 2.0E-01 | 1.41 |
|
SEPHS1 SLC16A1 |
Selenophosphate synthetase 1 Solute carrier family 16, member 1 |
1.4E-01 2.6E-03 |
1.29 1.81 |
| SNRPN | Small nuclear ribonucleoprotein polypeptide N | 1.0E-21 | 3.56 |
| SNURF | SNRPN upstream reading frame | 1.3E-01 | -1.18 |
|
SOX2 TFGF1 TERF1 UGP2 UNG USP9X ZIC3 |
SRY (sex determining region Y)-box 2 Teratocarcinoma-derived growth factor 1 Telomeric repeat binding factor 1 UDP-glucose pyrophosphorylase 2 Uracil-DNA glycosylase Ubiquitin specific peptidase 9. X-linked Zic family member 3 |
3.3E-01 2.9E-01 2.8E-01 7.3E-03 1.3E-01 1.0E-21 4.4E-03 |
2.02 1.29 1.34 1.62 1.17 3.94 1.55 |
| Gene Symbol | Gene | P-value | FC |
|---|---|---|---|
| OPN / SPP1 | Osteopontin / Secreted phosphoprotein 1 | 1.4E-04 | 54.03 |
| TMEFF2 | Transmembrane protein with EGF-like domains 2 | 1.9E-11 | 45.25 |
| IGFBP7 | Insulin-like growth factor binding protein 7 | 3.2E-05 | 39.40 |
| NRK | Nik related kinase | 1.8E-03 | 30.79 |
| CD58 / LFA-3 | Lymphocyte function-associated antigen3 | 6.3E-12 | 25.99 |
| CTHRC1 | Collagen triple helix repeat containing 1 | 2.7E-04 | 25.40 |
| ANXA1 | Annexin A1 | 2.9E-05 | 23.34 |
| EIF5B | Eukaryotic translation initiation factor 5B | 3.1E-14 | 20.79 |
| CDC2 | Cell division cycle 2 | 4.6E-09 | 19.40 |
| ANKRD12 | ankyrin repeat domain-containing protein 12 | 1.1E-12 | 18.24 |
| COL12A1 | Collagen, type XII, alpha 1 | 1.8E-08 | 14.93 |
| FAM76B | Family with sequence similarity 76, member B | 5.6E-20 | 14.93 |
| HPGD | Hydroxyprostaglandin dehydrogenase 15-(NAD) | 1.6E-03 | 14.15 |
| NUDCD2 | NudC domain containing 2 | 1.7E-19 | 13.40 |
| DNAJA5 | DnaJ homology subfamily A member 5 | 1.2E-04 | 13.30 |
| TWIST1 | Twist-related protein 1 | 2.5E-07 | 12.41 |
| OR5T2 | Olfactory receptor, family 5, subfamily T, member 2 | 1.6E-11 | 12.31 |
| FANCB | Fanconi anemia, complementation group B | 6.4E-10 | 11.31 |
| MRPS15 | Mitochondrial ribosomal protein S15 | 3.4E-13 | 11.06 |
| TXN | Thioredoxin | 1.9E-13 | 11.06 |
| FKBP5 | FK506 binding protein 5 | 4.3E-11 | -17.55 |
| PTPN11 | Protein tyrosine phosphatase | 6.2E-07 | -17.68 |
| ZMYND11 | Zinc finger, MYND domain containing 11 | 1.6E-11 | -18.10 |
| TP53BP1 | Tumor protein p53 binding protein, 1 | 5.4E-08 | -18.38 |
| PLK4 | Polo-like kinase 4 (Drosophila) | 3.4E-07 | -19.70 |
| LMAN1 | Lectin, mannose-binding, 1 | 2.2E-05 | -20.63 |
| ERBB2 | Human Epidermal growth factor Receptor 2 | 7.4E-16 | -23.52 |
| NUMA1 | Nuclear mitotic apparatus protein 1 | 5.6E-15 | -23.88 |
| NUP188 | Nucleoporin 188kDa | 2.5E-10 | -25.79 |
| FOS | Cellular proto-oncogene | 4.1E-10 | -28.73 |
| EXOC4 | Exocyst complex component 4 | 3.9E-08 | -29.18 |
| MLLT4 | Myeloid/lymphoid or mixed-lineage leukemia | 3.4E-15 | -34.03 |
| EWSR1 | Ewing sarcoma breakpoint region 1 | 1.9E-07 | -37.33 |
| SFRS11 | Splicing factor, arginine/serine-rich 11 | 2.3E-10 | -37.33 |
| DUSP6 | Dual specificity phosphatase 6 | 1.7E-08 | -43.88 |
| TFRC/ CD71 | Transferrin receptor (p90, CD71) | 5.5E-09 | -49.26 |
| EGR1 | Early growth response Protein 1 | 1.1E-12 | -50.02 |
| HEATR1 | HEAT repeat containing 1 | 6.5E-06 | -58.35 |
| FOSB | FBJ murine osteosarcoma viral oncogene homolog B | 1.9E-08 | -59.26 |
| DHX9 | DEAH (Asp-Glu-Ala-His) box polypeptide 9 | 9.8E-07 | -60.18 |
Due to protein-protein interaction analysis which has revealed that several of the hub genes identified encode for RGD-associated proteins, a specific search for the expression of differentially regulated RDG-associated genes was performed. Among these, 11 genes show a significantly higher expression in MFG-hESCs compared to hESCs (Table 3). Identified markers belonging to this family of genes with the largest differential expression are ITGB6 and OPN, displaying respectively an FC of 19 and 54.
| Gene Symbol | Gene | P-value | FC |
|---|---|---|---|
| OPN | Osteopontin | 1.0E-04 | 54.03 |
| ITGB6 | Integrin beta 6 | 3.7E-02 | 19.10 |
| ITGB1 | Integrin beta 1 | 1.0E-21 | 16.89 |
| CD47 | CD47 | 7.6E-03 | 8.38 |
| COL4A3 | Collagen IV alpha 3 | 1.0E-04 | 5.83 |
| ITGB5 | Integrin beta 5 | 8.0E-04 | 4.52 |
| ITGB3 | Integrin beta 3 | 1.0E-03 | 4.25 |
| THBS1 | Thrombospondin | 6.0E-04 | 3.82 |
| CTSZ | Cathepsin Z | 1.0E-21 | 3.68 |
| FBN1 | Fibrillin 1 | 1.2E-02 | 3.43 |
| FN1 | Fibronectin 1 | 1.3E-02 | 3.43 |
| MADCAM1 | Mucosal addressin cell adhesion | 4.1E-03 | 2.81 |
| NAPSA | Napsin A | 1.0E-21 | 2.39 |
| ITGA2B | Integrin alpha 2 beta | 4.9E-02 | 2.33 |
| NID1 | Nidogen 1 | 1.0E-21 | 2.26 |
| VWF | Von Willebrand factor | 2.5E-02 | 2.13 |
| TNR | Tenascin R | 4.0E-02 | 2.06 |
| ITGA9 | Integrin alha 9 | 4.8E-02 | 2.05 |
| LAMA1 | Laminin alpha 1 | 1.0E-21 | -2.03 |
3.2. Real-Time PCR Shows High Expression of Pluripotency-Associated Genes in MFG-hESCs
Real-time PCR was used to confirm the expression of some of the genes specifically expressed in hESCs, or under- and over-expressed in hESC compared to differentiated cells, such as NANOG, OCT4, TDGF1, GAL, SOX2, IGFBP7, COL5A2, and COL11A1. The results in Fig. (3) show that the pluripotency-associated NANOG, OCT4, TDGF1, and SOX2 genes are more highly expressed in MFG-hESCs than in hESCs. No significant differences are observed when comparing the expression of the other investigated genes.
3.3. Flow cytometry analysis shows high expression of the integrins and the cell adhesion markers in MFG-hESCs
The increased expression of surface adhesion molecules in MGF-hESCs compared to hESCs was verified by flow cytometry. The results confirm that MGF-hESCs display higher expression of the integrins ITGB3 and ITGB6, and the cell adhesion markers CD58, CD47, and CD44 compared to hESCs (Fig. 4).
 |
Fig. (3). Verification of microarray results using quantitative real-time PCR analysis for NANOG, OCT4, TDGF1, SOX2, GAL, IGFB7, COL5A2, and COL11A1 expression in feeder-cultured hESCs and MFG-hESCs. Data represent averages ± SD (* indicates P < 0.05). Abbreviations: hESCs, human embryonic stem cells; MFG-hESCs, matrix-free growth adapted human embryonic stem cells. |
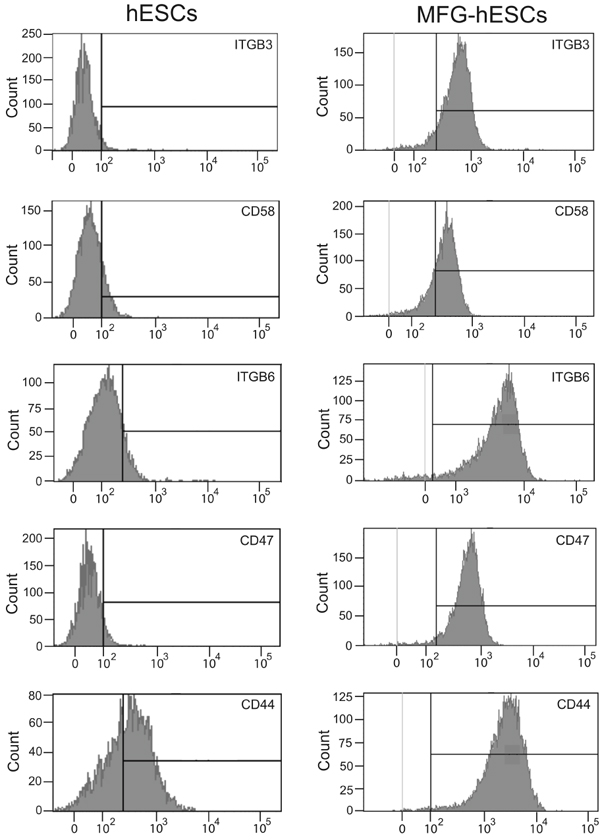 |
Fig. (4). Flow cytometry analysis of ITGB3, CD58, ITGB6, CD47, and CD44 for feeder-cultured hESCs and MFG-hESCs. Abbreviations: hESCs, human embryonic stem cells; MFG-hESCs, matrix-free growth adapted human embryonic stem cells. |
3.4. Higher expression of Integrins is Responsible for the MFG-hESCs Ability to Adhere and Grow on Regular Plastic Culture Dishes
In order to determine whether the higher expression of integrins on the MFG-hESCs was responsible for the ability of these cells to attach and grow on regular plastic culture dishes, the cells were cultured in the presence of RGD or RGES peptides. The results in Fig. (5) show significantly less cell attachment when MFG-hESCs are cultured in the presence of the RGD peptides compared to the RGES peptide, with approximately 65% less cell attached in the presence of RGD peptides.
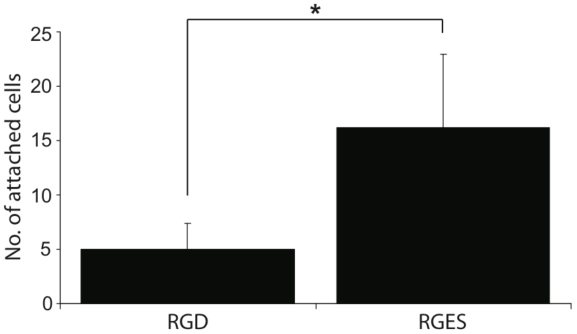 |
Fig. (5). MFG-hESCs cultured on tissue culture plastic in the presence of RGD or RGES peptides. Data represent averages ± SD (*indicates P < 0.05). Abbreviations: MFG-hESCs, matrix-free growth adapted human embryonic stem cells; RGD, Arg-Gly-Asp. RGES, Arg-Gly-Glu-Ser. |
4.DISCUSSION
Stem cells have generated great enthusiasm over the last decades in relation to their potential in basic and applied research, and in the clinics. Under proper culture conditions, hESCs can be expanded to large numbers and still retain the potential to differentiate into tissues of all three germ layers [23-26]. However, despite recent improvements in culture conditions [7, 12] the expensive, labor-intensive and inconsistent in vitro expansion still constitute an obstacle for the bulk production of pluripotent stem cells, and MFG-hESCs could represent a suitable alternative for both research and translational applications.
To understand the mechanisms behind the unique ability of MFG-hESCs to adhere and grow in feeder- and matrix-free conditions, in this study we performed a global gene expression analysis of these cells, and compared the results with those generated from feeder-cultured hESCs. Interestingly, the majority of genes specifically expressed in undifferentiated hESCs [27] were also expressed in MFG-hESCs, with a corresponding level of expression in the two cell types. Real-time PCR data revealed that MFG-hESCs display an increased expression of genes involved in the establishment and maintenance of pluripotency compared to the feeder-cultured hESCs, such as NANOG, OCT4, and the transcription factor SOX2, which is known to form a complex with OCT4 and to bind to the NANOG promoter [28, 29]. These results are in accordance with previous results reported by our group, showing that MFG-hESCs grow as colonies with a morphology equivalent to cells cultured on MatrigelTM, express the pluripotency markers OCT4, SSEA3, SSEA4, TRA-1-60, TRA-1-81, and SSEA1, differentiate into derivatives of all three germ layers in vitro and in vivo, and maintain a normal karyotype [17, 18].
Likewise, the majority of the genes overexpressed in undifferentiated hESCs compared to differentiated cells were found to be similarly expressed in both cell types investigated, demonstrating that the derivation process of MFG-hESCs does not induce molecular changes toward a differentiated cell phenotype [27]. Identified hub genes induced upon MFG-hESC derivation, include several genes encoding for ribosomal proteins, such as RPLP2, RPL38, RPL37A, RPL27A, and RPS11, as well as the translation initiator IF2. Another ribosomal gene significantly upregulated in MFG-hESCs was MRPS15, encoding for the mitochondrial ribosomal protein S15. High expression of ribosomal genes have been reported in tissues containing a high percentage of proliferating cells [30, 31] Richards et al. previously demonstrated a significant increase in the expression of ribosomal genes in hESCs compared to cells from adult tissues [31], which is indicative of the high proliferation rate of pluripotent stem cells. The higher expression of these genes in MFG-hESCs reflects their high proliferation ability, which is beneficial for the large-scale manufacturing for experimental and translational applications. The active proliferation state of hESCs is also associated with an increased expression of genes involved in mRNA processing and RNA transport from the nucleus [32]. We found that while MFG-hESCs displayed higher expression of the mRNA processor genes RBM16, PSIP1, and SNRPN, feeder-cultured hESCs displayed higher expression of the hub genes HNRNPH1, HNRNPU, SFRS11, SF3B1, PRPF6, DHX9, NUP133, and NUP100, which are recognized to play a role in pre-mRNA processing and other aspects of mRNA metabolism and transport [33-37]. Taken together, the data revealed that both MFG-hESCs and feeder-cultured hESCs highly express several genes involved in cellular processes such as chromatin remodelling, gene transcription, RNA processing and export, as well as protein synthesis [38].
Other genes showing higher expression in hESCs than MFG-hESCs were FRS2, Mxi2, BMK1, SYD1, FOS, FOSB, GOS3, JUN, JUND, and EWSR1, which are involved in hESC proliferation, survival and cancerogenesis [39-41]. As opposite, MFG-hESCs displayed increased expression of several tumor suppressor genes, including CAV1 and its accessory protein CAV2, and TMEFF2, whose downregulation is associated with oncogenic cell transformation, tumorigenesis and metastasis [42, 43]. Moreover, MFG-hESCs displayed a significantly higher expression of FANCB compared to hESCs, which is involved in DNA repair during replication [44], suggesting that MFG-hESC display a rigid control of the cell cycle, a characteristic that could facilitate future clinical applications of these cells. Most cells derived from solid tissues are adherent. Tissue culture polystyrene supports cell attachment and growth following deposition of serum proteins, such as fibronectin and vitronectin to the plastic surface [45]. It is established that the strength of cell attachment is proportional to the amount of deposited proteins [46], and the number of bindings between the cell and the material surface [47]. After deposition, the protein layer functions as a primary ECM-like scaffold for the cells to attach. Different cell types display different ability to attach to regular plastic culture dishes, but no successful culturing of pluripotent stem cells in similar conditions has been reported to date. As opposite, we recently demonstrated that MFG-hESCs attach and grow on regular plastic culture dishes [17]. The results of this study show that MFG-hESCs display a significantly increased expression of genes encoding for integrins, RGD-binding proteins and other adhesion molecules. The high expression of integrins observed on undifferentiated MFG-hESCs in contrast to feeder-cultured hESCs, prompted us to study the importance of these proteins as a possible explanation for the attachment and growth of MFG-hESCs. Functional assays confirmed our assumption, resulting in decreased cell attachment as evidenced by a 65% loss in cell attachment in presence of RGD peptides.
Integrins are a large family of cell adhesion receptor proteins that interact with fibronectin and other ECM proteins, provide transmembrane links between the ECM and the cytoskeleton and play a crucial role in the regulation of cell adhesion, survival and proliferation [48-52]. Therefore, the significantly increased expression of ITGB1, ITGB3, ITGB5, ITGB6, and FN1, and other adhesion markers and ECM proteins including CD44, CD47, and CD58 likely play an important role in the unique ability of MFG-hESCS to firmly attach to regular plastic culture dishes. In addition, microarray data revealed that MFG-hESCs display increased expression of the COL4A3 gene, encoding for a major structural protein of basement membranes, which is highly present in MatrigelTM and recognized to enhance the attachment and growth of several different cell types [53]. Again, the increased expression of COL4A3 may play a major role in the adhesion properties of these cells. It remains to be seen whether the controlled up-regulation of these genes, or a combination thereof, in pluripotent stem cells (both hESCs and hiPSCs) results in the ability of these cells to grow on regular plastic culture dishes and yet maintain an undifferentiated phenotype.
A similar technology would allow the generation and mass production of next-generation pluripotent stem cell lines for basic and translational research, in a reproducible, GMP-compliant and economically affordable fashion. Moreover, the feeder- and matrix-free properties of MFG-hESCs present the opportunity to design long-term differentiation studies in a monolayer culture system, which has not been possible due to loss of feeder or degradation of coating material over time.
CONCLUSION
Eliminating the need for feeder cells and coating products improves the purity of pluripotent stem cell culture and simplifies the culture procedures, thus allowing the manufacturing of cells for basic and translational research, in a reproducible, GMP-compliant and economically affordable fashion. The unique ability to attach and grow on regular plastic culture dishes makes MFG-hESC an appealing alternative to conventionally cultured hESCs for bulk production of high-quality pluripotent stem cells for a large set of biomedical applications.
AUTHOR CONTRIBUTION
Narmin Bigdeli: conception and design, collection and/or assembly of data, data analysis and interpretation, manuscript writing, final approval of manuscript
Giuseppe Maria de Peppo: conception and design, collection and/or assembly of data, data analysis and interpretation, manuscript writing, final approval of manuscript
Camilla Karlsson: conception and design, data analysis and interpretation, manuscript writing, final approval of manuscript
Maria Lennerås: data analysis and interpretation, final approval of manuscript
Raimund Strehl: provision of study material, final approval of manuscript
Johan Hyllner: provision of study material, final approval of manuscript
Anders Lindahl: conception and design, financial support, final approval of manuscript
ETHICS APPROVAL AND CONSENT TO PARTICIPATE
Not applicable.
HUMAN AND ANIMAL RIGHTS
No Animals/Humans were used for studies that are base of this research.
CONSENT FOR PUBLICATION
Not applicable.
CONFLICT OF INTEREST
The authors declare no conflict of interest, financial or otherwise.
ACKNOWLEDGEMENTS
We thank Katarina Junevik for expert technical assistance with flow cytometry analysis at the flow cytometry laboratory at the department of clinical chemistry and transfusion medicine, Sahlgrenska University Hospital, Gothenburg, Sweden